.jpeg)
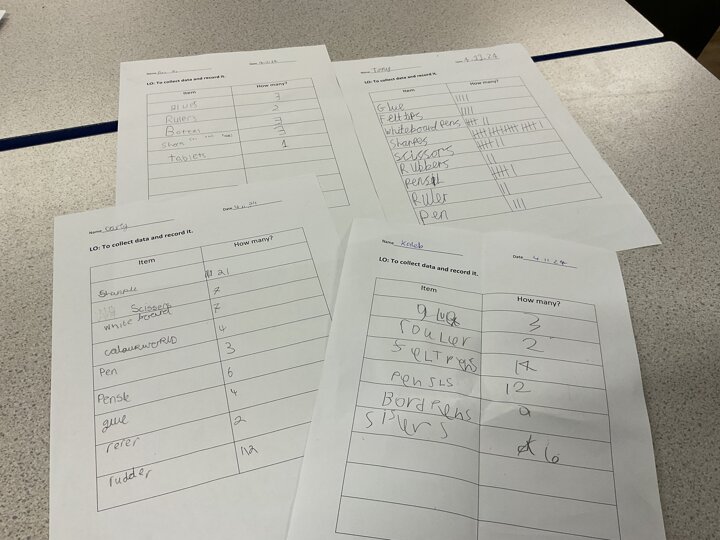
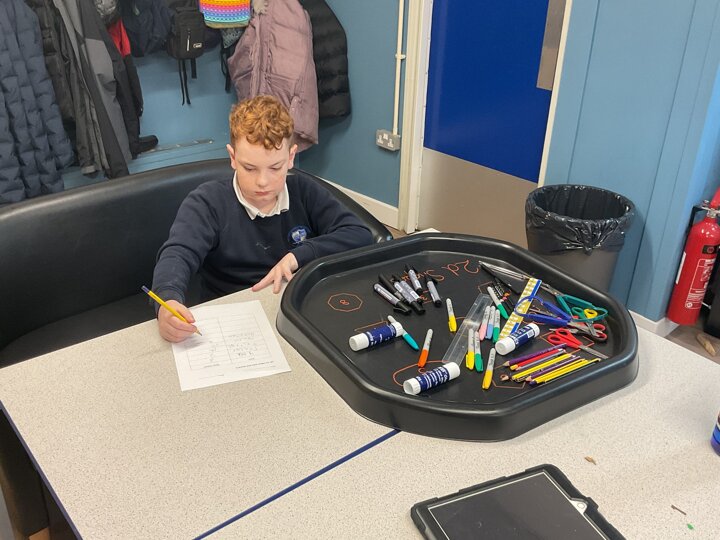
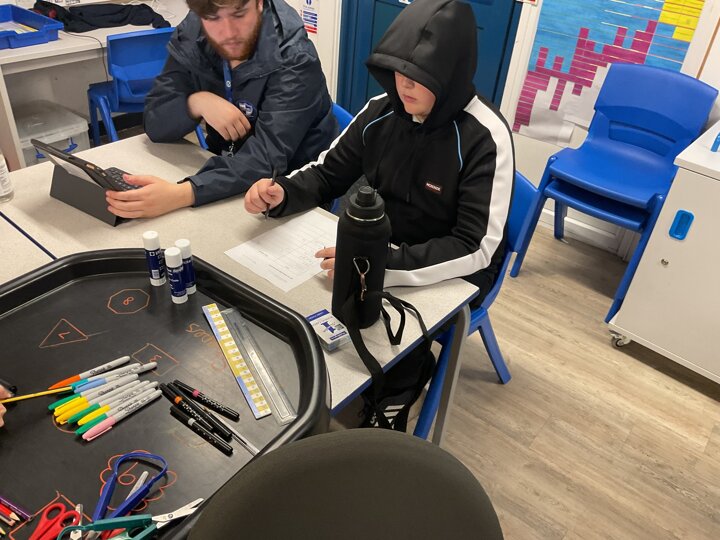
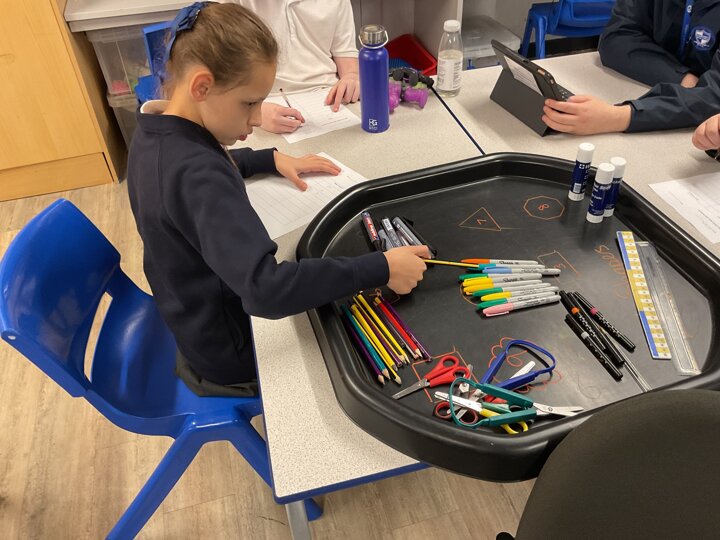
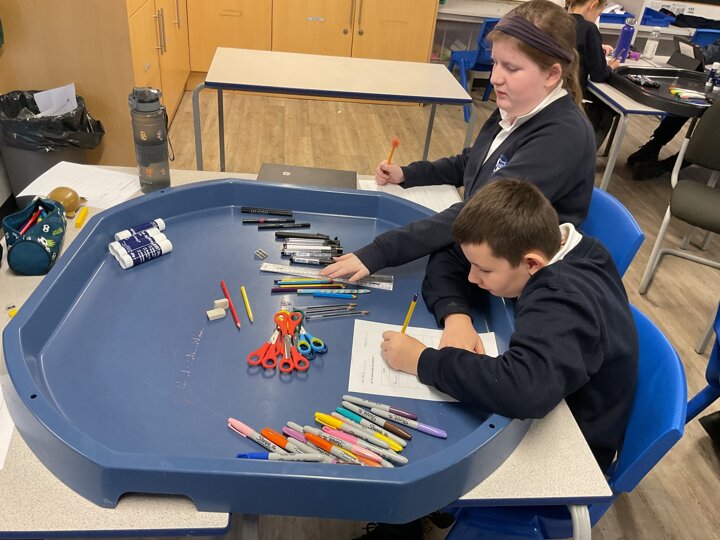
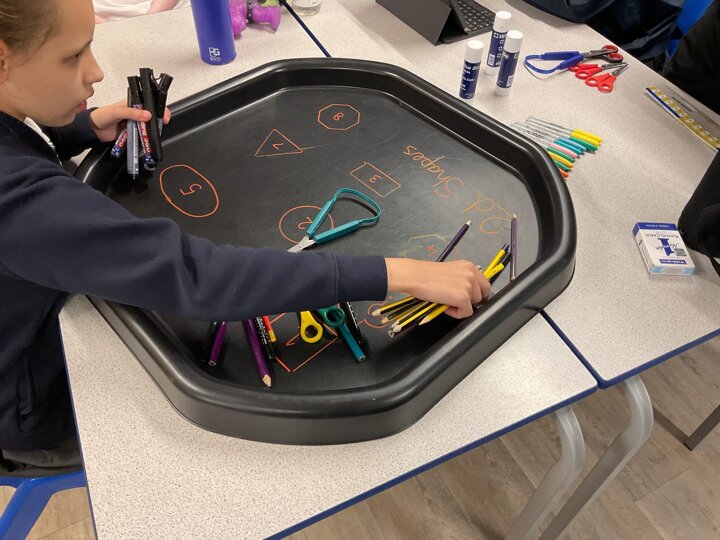
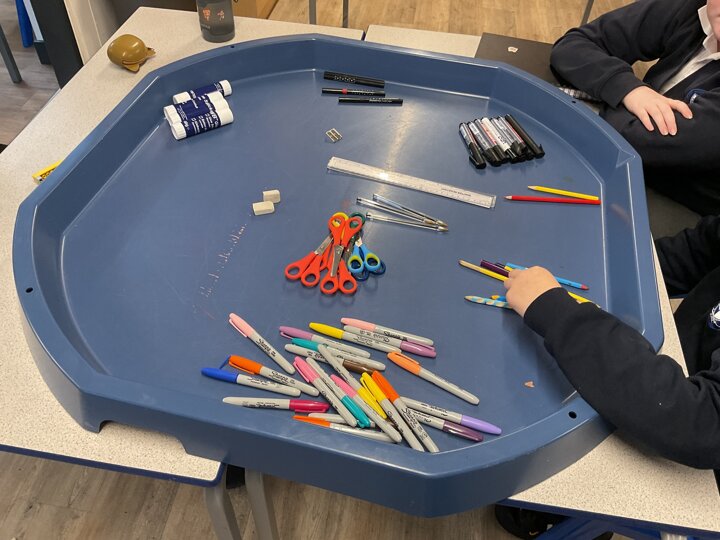
In Computing today, 3L have been collecting data from tuff trays and representing the data using Microsoft Excel. Students sorted classroom items in the tuff trays, counted how many of each item there were and then this information was recorded in a table on a spreadsheet, then a bar graph was filled in. From this data, students could then see which items we needed more stock of.
.jpeg)
.jpeg)
.jpeg)